VEXPLOR
VEXPLOR DATAFLOWS

Draw the analysis,and it becomes an API.

DataFlows is the no-code data analytics and ML workflow module. Draw a data flow on the canvas and it runs as drawn, then deploys as a REST API.

NODES 70 · CATEGORIES 12 · REST API DEPLOY
VEXPLOR DATAFLOWS · ML PIPELINE CANVAS
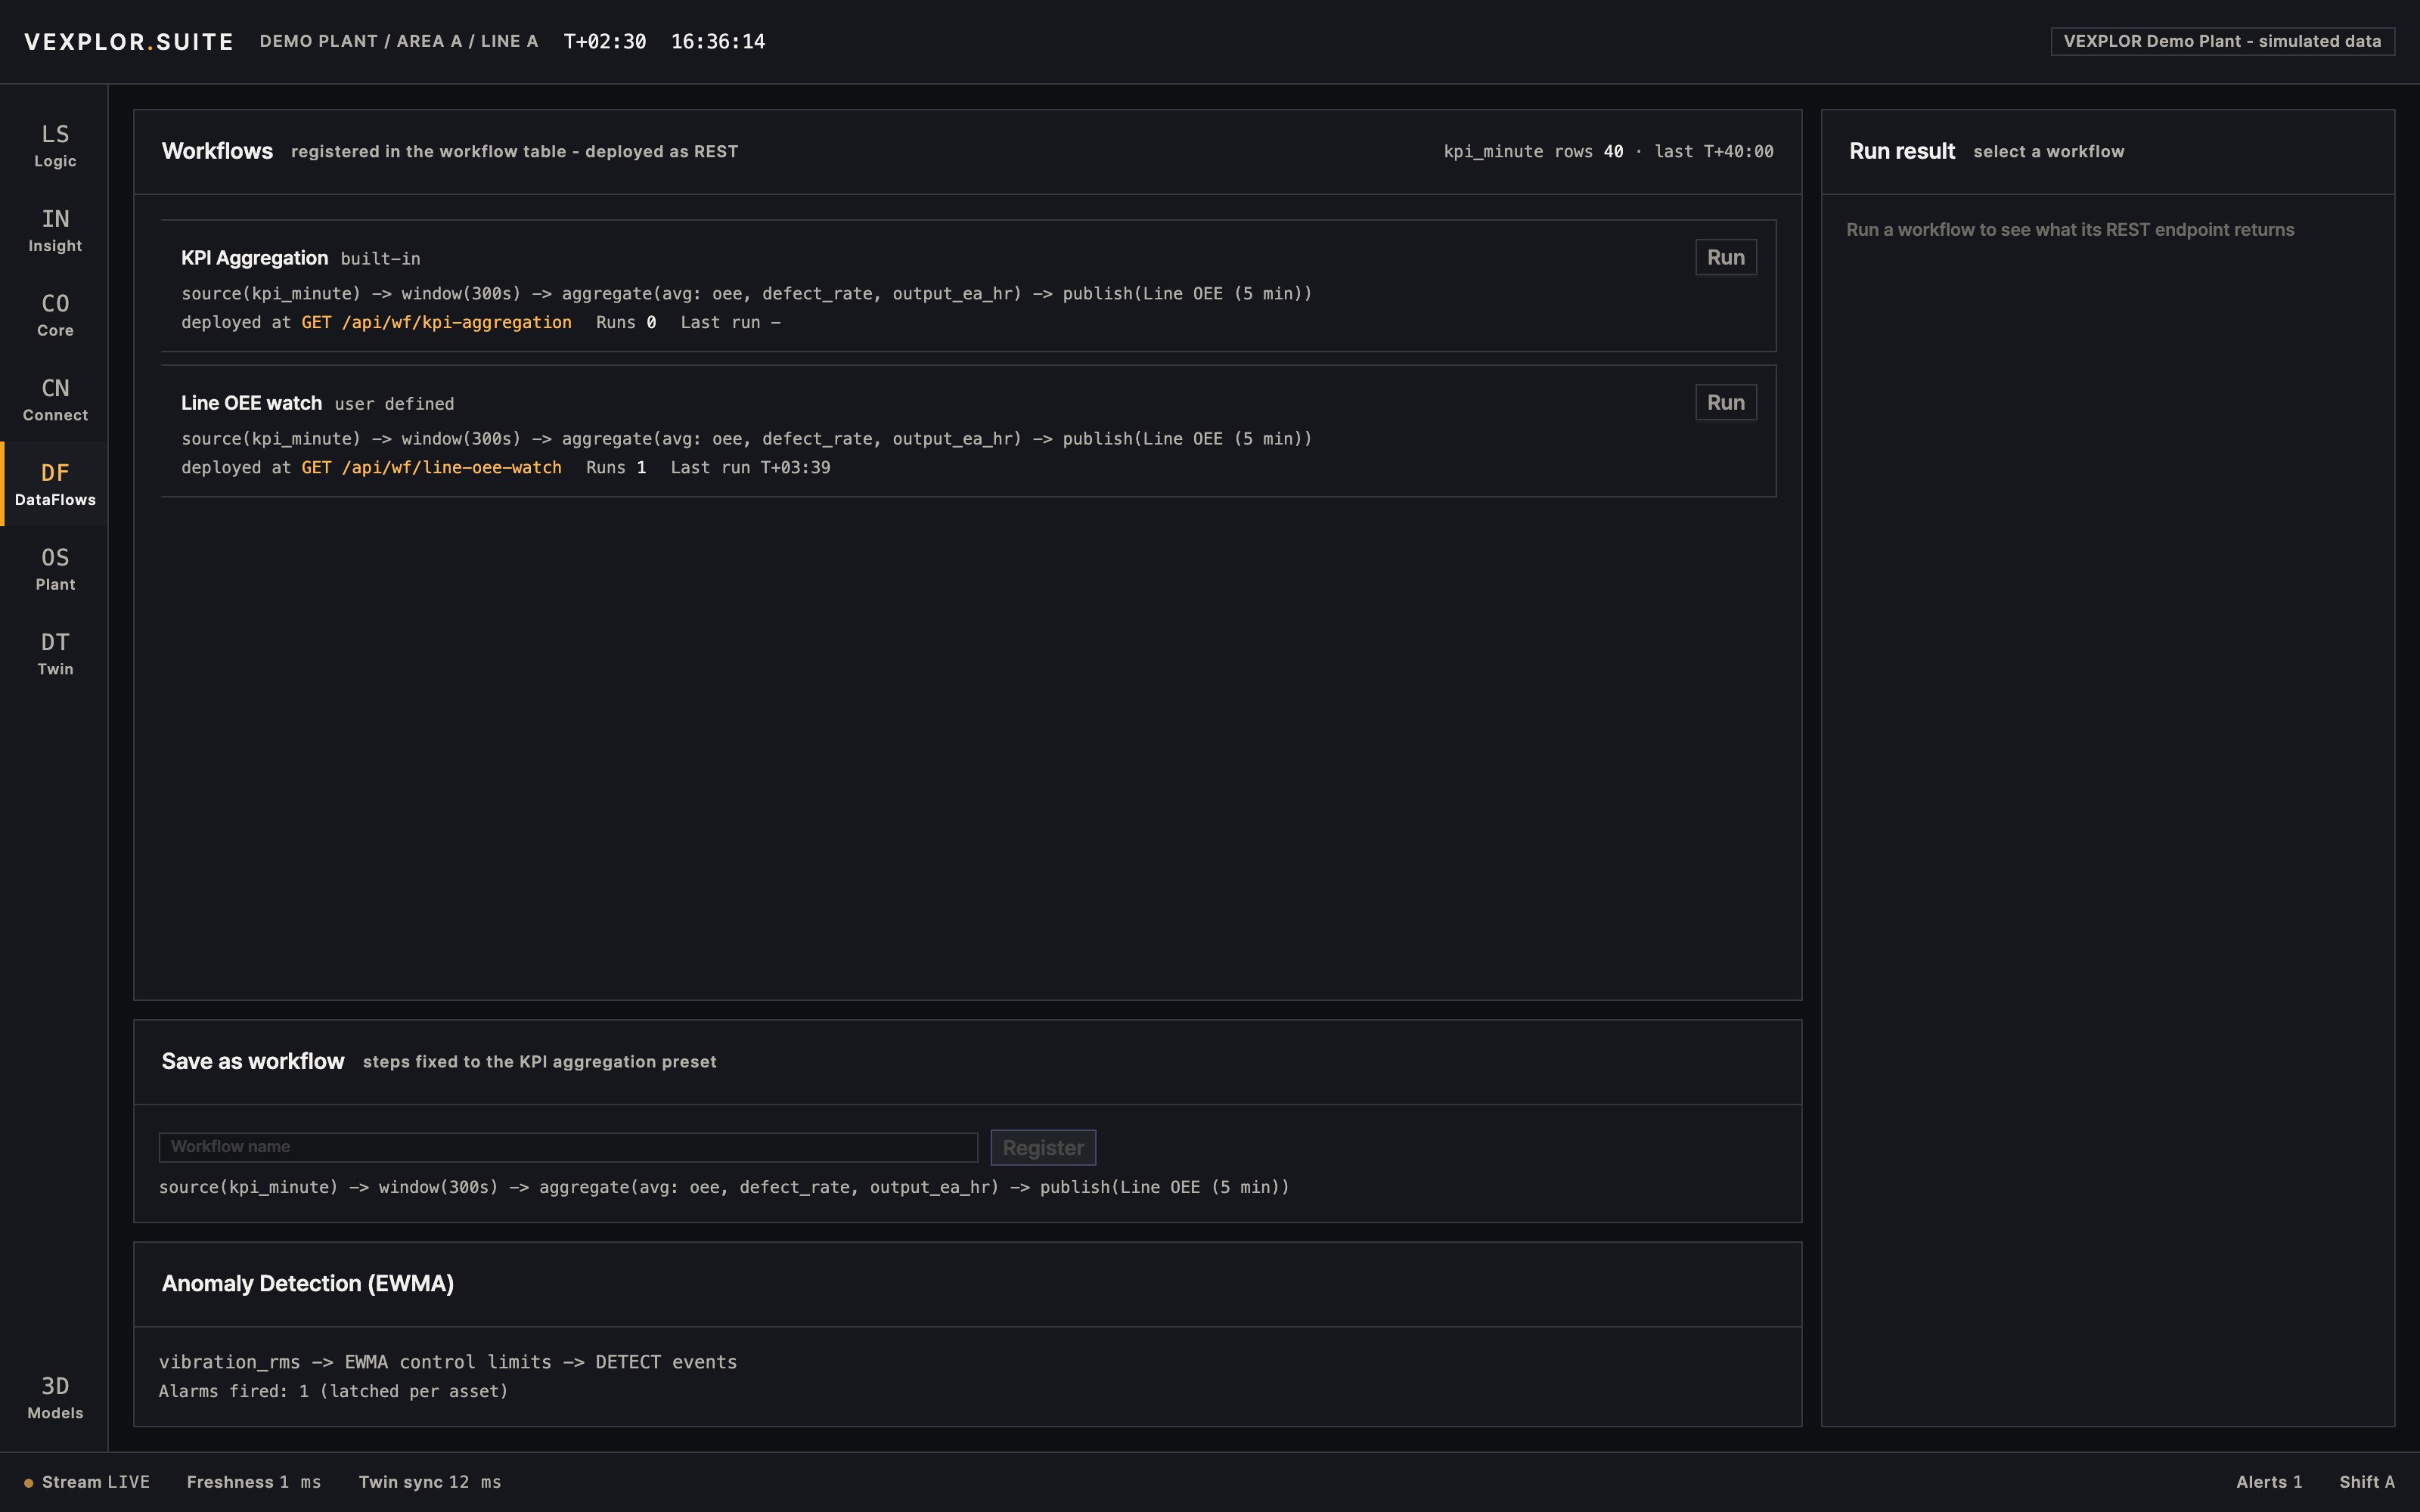
DataFlows workflow deployment and anomaly detection — product screen (demo plant, simulated data)
FIG — DB SOURCE → PREPROCESS → MODEL → OUTPUT(API) · PRODUCT SCREENScreen data is illustrative
SOURCE → PREPROCESS → MODEL / ANALYTICS → OUTPUT [ REST API · SHOP-FLOOR APP · DASHBOARD WIDGET ]FIG — DRAW-TO-API PATH · The flow you draw runs and deploys as-is
01PROBLEMANALYSIS DIES IN THE NOTEBOOK

The same data wrangling
repeats every week.

For a single analysis, you manually repeat data-extraction requests and Excel wrangling. The models an analyst builds never connect to shop-floor systems — they end inside a notebook.

  • No-code workflow canvasConnect 70 operation nodes in 12 categories to draw an ingest-clean-analyze-deploy flow.NODES70 · 12 CATEGORIES — INGEST · CLEANSE · STATISTICS · ML · OPTIMIZATION · SIGNAL PROCESSING AND MORE
  • Runs as drawnThe flow you draw runs as-is.RUNAS DRAWN
  • REST API deploymentDeploy a finished analysis or model as an API so shop-floor screens and other systems use it directly.DEPLOYREST API · SHOP-FLOOR APP · DASHBOARD WIDGET
70Operation nodes in 12 categories — ingest, cleanse, statistics, ML, optimization, signal processing and more
3Database connectors — PostgreSQL · MS-SQL · MongoDB
REST APIDeploy the flow you draw, as-is

Analysis on the floor becomes the company's asset.

On the platform, analyses and models become part of the system.

Platform OverviewRequest a Diagnosis